Appearance
Reports — Results & Export
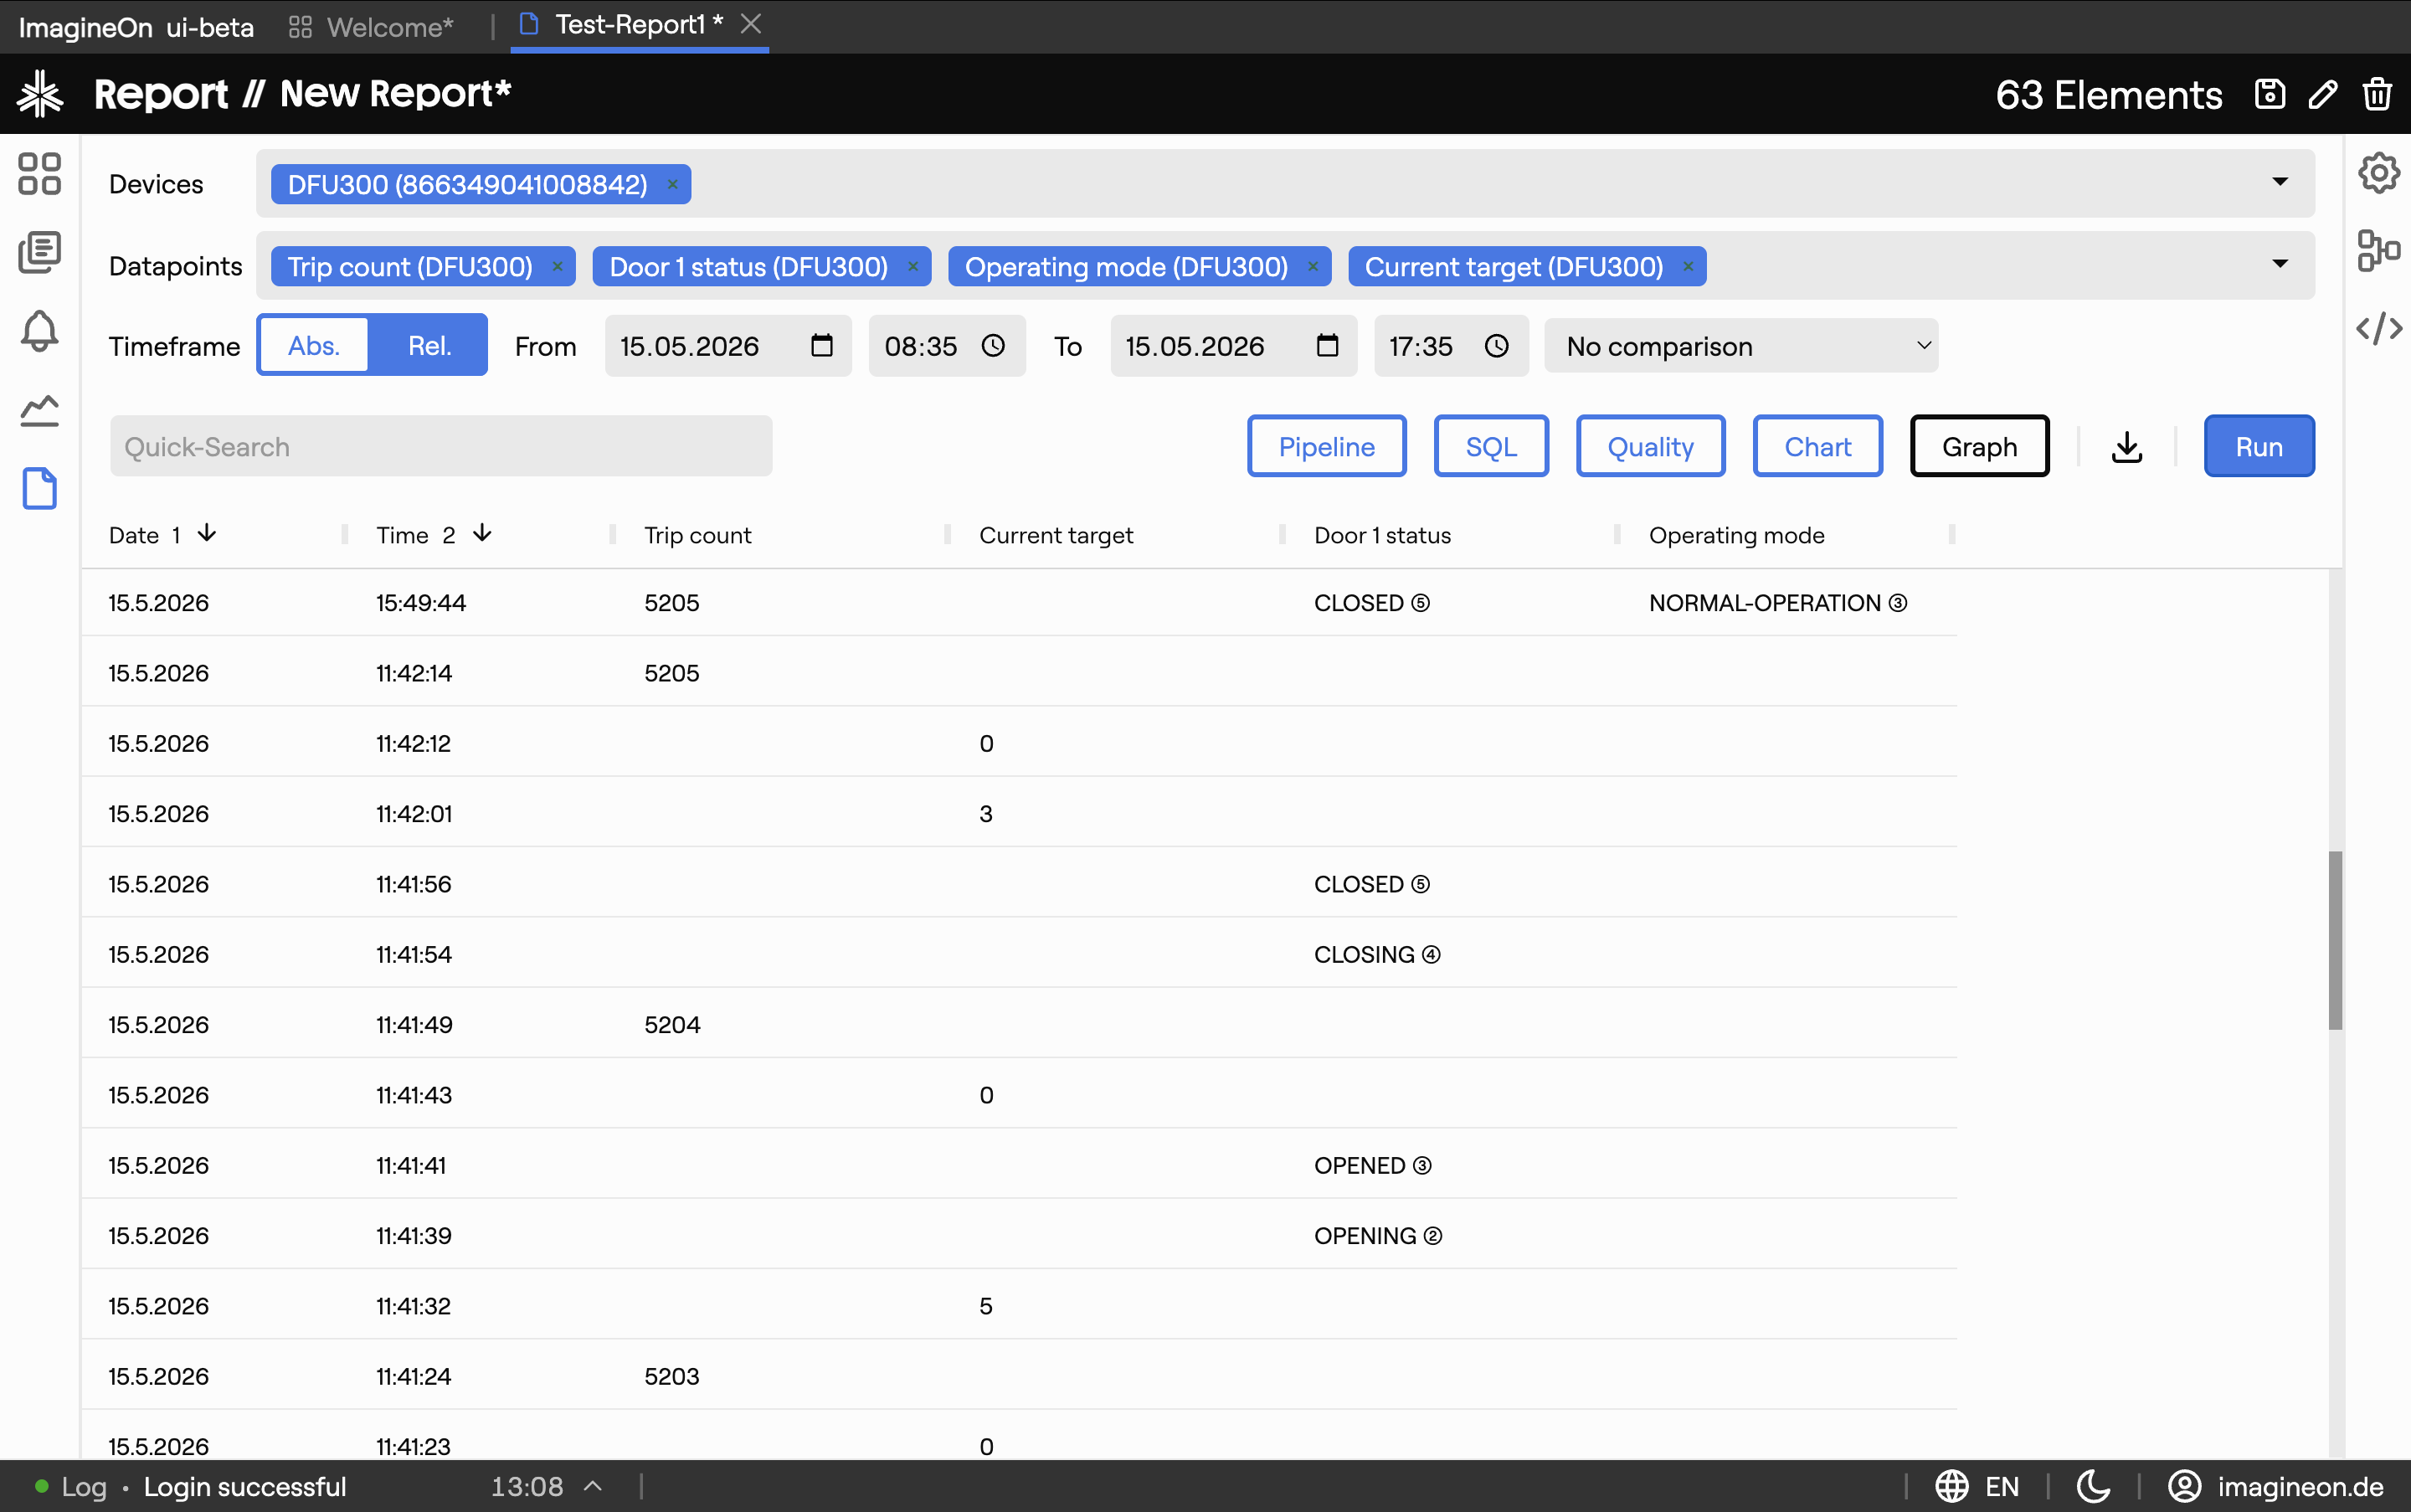
The Reports view (/data) shows the result of a query as a table, with an optional chart preview, and lets you export the data as CSV, Excel or PDF. This page covers everything that happens after the query has been built.
For the query-building side, see Reports — Building Queries.
Contents
1. Chart preview
An optional chart preview renders the result as a bar, line or pie chart depending on the query shape. This is a quick visual sanity check — for a richer chart workflow, use the Analytics view.
The chart can be included in PDF exports (see §3).
2. Result table
The result table at the bottom shows the actual output of your query.
- Columns — generally one per property, plus a timestamp column. When the Devices as columns toggle is on, each device gets its own column for the same property.
- Sorting / resizing — click column headers to sort; drag column edges to resize.
- Cell styling — interpolated values (filled in across gaps) are styled differently from raw values; bool and enum cells show the human-readable state name.
3. Exporting
The toolbar above the result table has three export buttons:
| Format | What you get |
|---|---|
| CSV | Tabular dump, spreadsheet-friendly. |
| Excel | Styled .xlsx with a header row matching the table layout. |
| Multi-page report with the Coldwave logo, the query summary, the result table, optionally the chart preview, and optionally the data-quality section. |
Filenames are data-YYYY-MM-DD-HH-MM-SS.<ext>.
4. Sharing and deep links
The current query is encoded into the URL — the ?q=… parameter contains a URL-safe base64 of the query state, updated automatically as you edit the query. This makes the URL useful as a bookmark within your own session to jump back to a particular query.
Heads-up. Sharing the URL with another user is not a reliable way to send them to the same query — Coldwave restores each user's last-open tabs on reload, which can override the URL. See URLs and tabs for the full caveats.
Planned. A saved queries library (with names, descriptions and a Save button in the toolbar) is on the roadmap.
5. Persistence — what is remembered
Per-user, persisted between sessions:
- Result table column layout — widths, visibility and sort order, per query shape.
Driven by the URL:
- The query itself — devices, properties, time range, transforms, compare mode.
Reset between sessions:
- Which builder panels are expanded (transforms / SQL / quality / chart).
- Devices-as-columns toggle.