Appearance
Fleet — Device Details
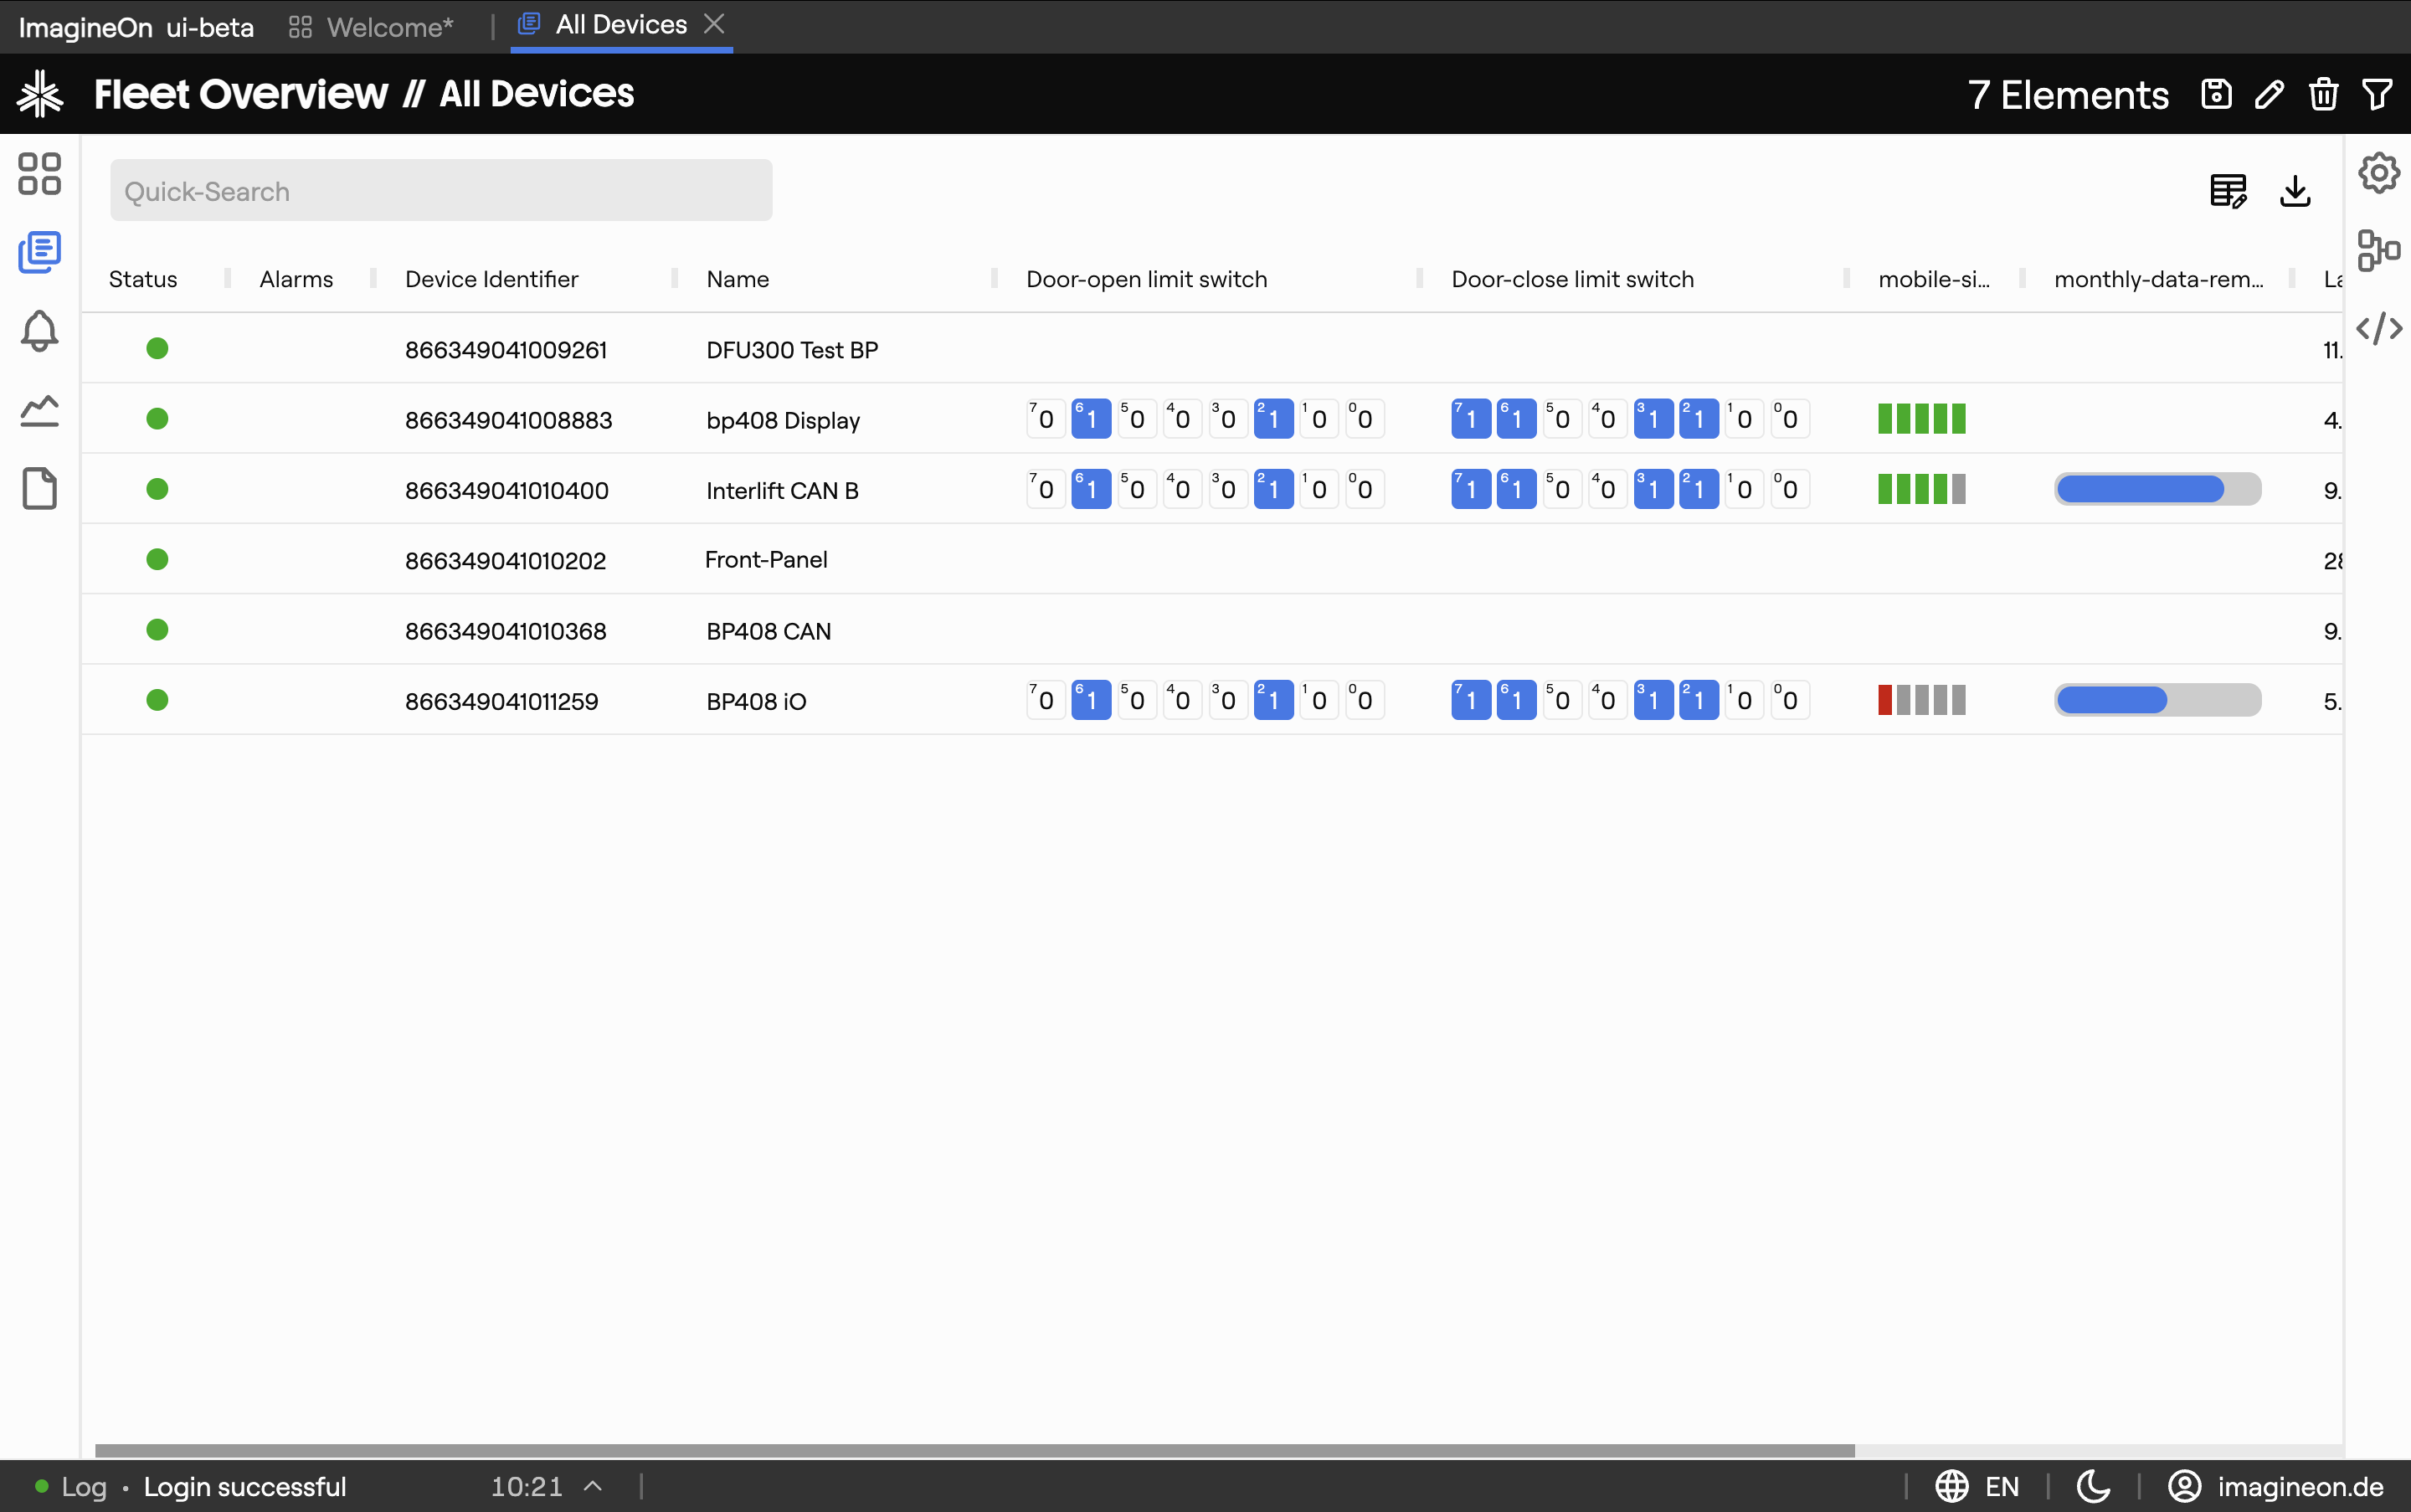
The Fleet view (/fleet) opens a detail panel on the right whenever you click a device in the list. This page covers that panel — the quick-info strip, the tab bar, and what each tab contains.
For the device list on the left of the screen, see Fleet — Device List.
Contents
- Quick info panel
- The tab bar
- Data tab
- Telemetry tab(s)
- Alarms tab
- Notes tab
- Deep links and tab forwarding
- Persistence — what is remembered
1. Quick info panel
Above the tab bar sits a compact status strip:
- Device name and identifier.
- Online / offline badge (green / grey).
- Custom status fields — your administrator can configure a small set of "always-visible" properties (e.g. battery %, current temperature, signal strength) so you can see the most important values without entering a tab.
The custom fields update live as new values arrive from the backend.
2. The tab bar
The tab bar shows one tab per detail view. The available tabs depend on the device:
- Data — always shown.
- Telemetry — one tab per service the device exposes (a device with two temperature sensors gets two telemetry tabs).
- Alarms — always shown; the tab badge turns red if active alarms exist.
- Notes — always shown.
The tab you last visited for a given device is remembered, so re-selecting the device returns you to the same place. When you switch to a different device, Coldwave tries to keep the same tab open if the new device also has it — useful for comparing telemetry across similar devices.
3. Data tab
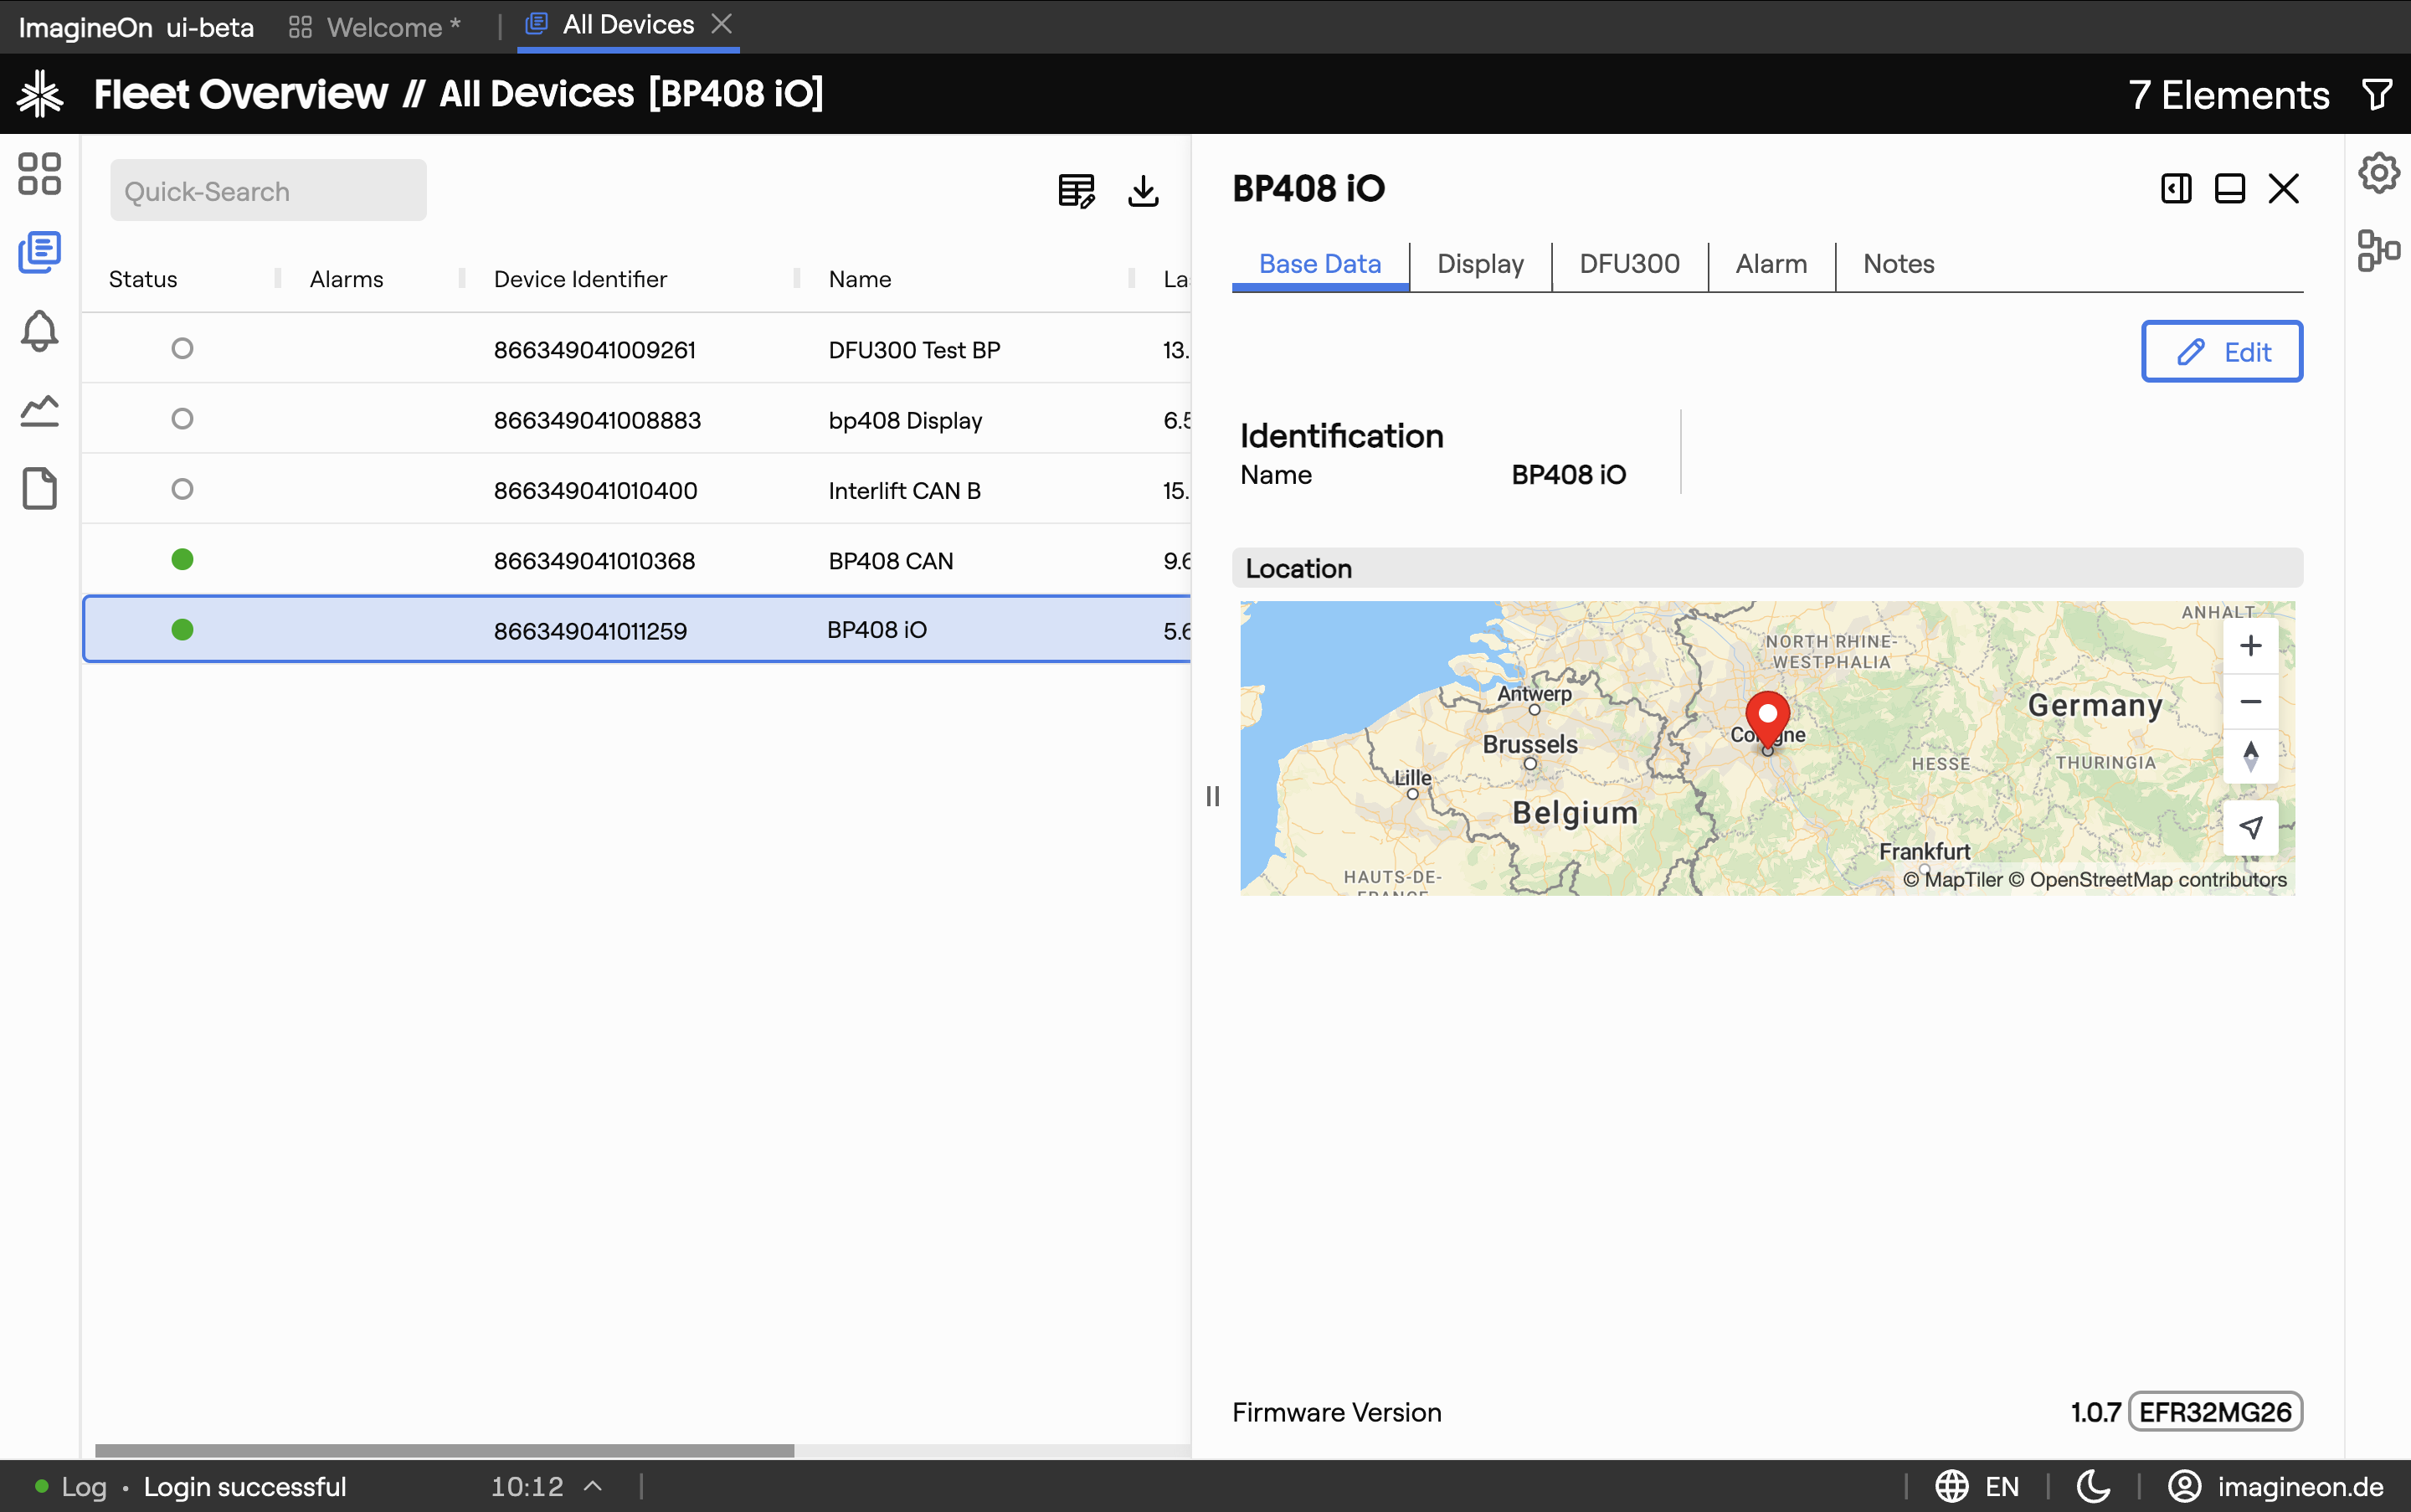
The Data tab shows the device's metadata and firmware information, organized in collapsible groups:
- Identification — device name, description, MAC address, serial number, etc.
- Firmware — version, build date, upgrade availability (if your backend reports it).
- Location — coordinates, address and an interactive map if the device has location metadata.
Some fields are editable. Click the Edit icon next to a field, change the value and click Save. Read-only fields (like the MAC address) have no edit affordance.
4. Telemetry tab(s)
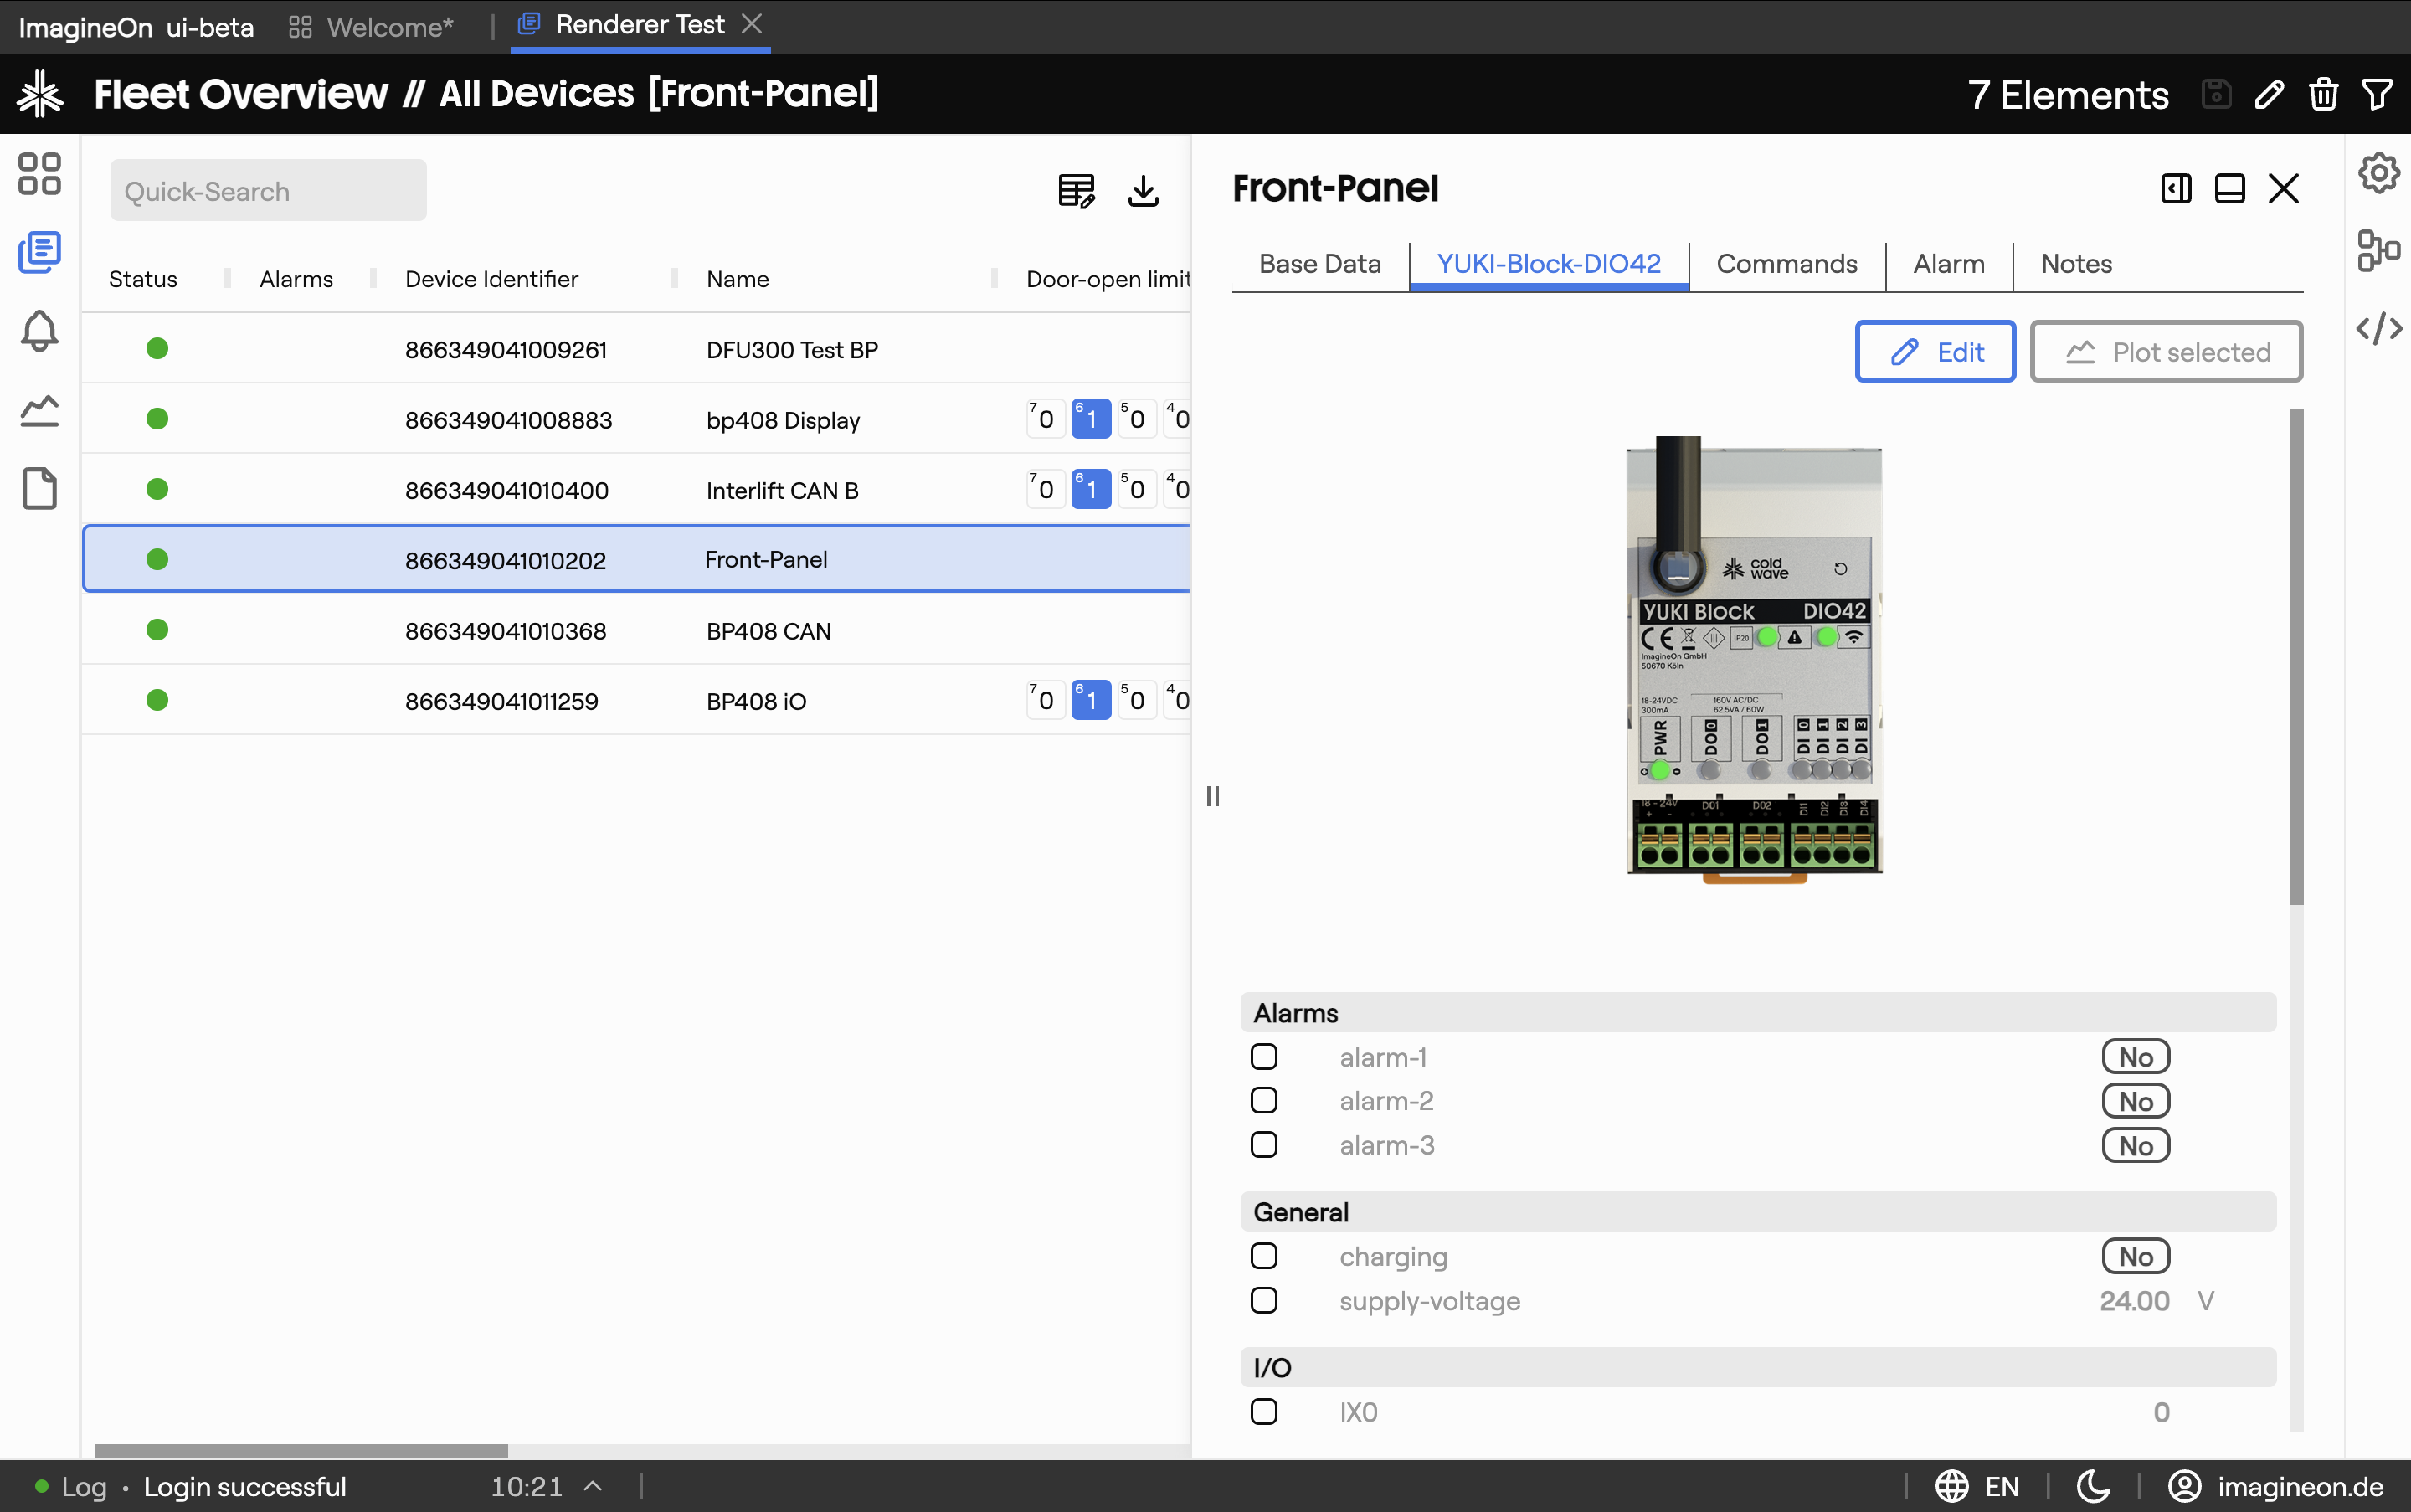
Each telemetry tab corresponds to one service on the device. Inside, properties are grouped into logical sections (e.g. "Environment", "Power") and update live — typically once per second.
For each property you see:
- Name and unit (e.g. "Inlet temperature [°C]").
- Current value, formatted for readability.
- Trend or gauge for numeric properties, when the property's display hint requests it.
Telemetry values are read-only. To plot a property over time, jump to the Analytics view — see §7 for how to deep-link.
Multi-service devices. A device that has two of the same service (for example two temperature sensors) gets one tab per instance — labelled "Temperature 1", "Temperature 2", etc.
5. Alarms tab
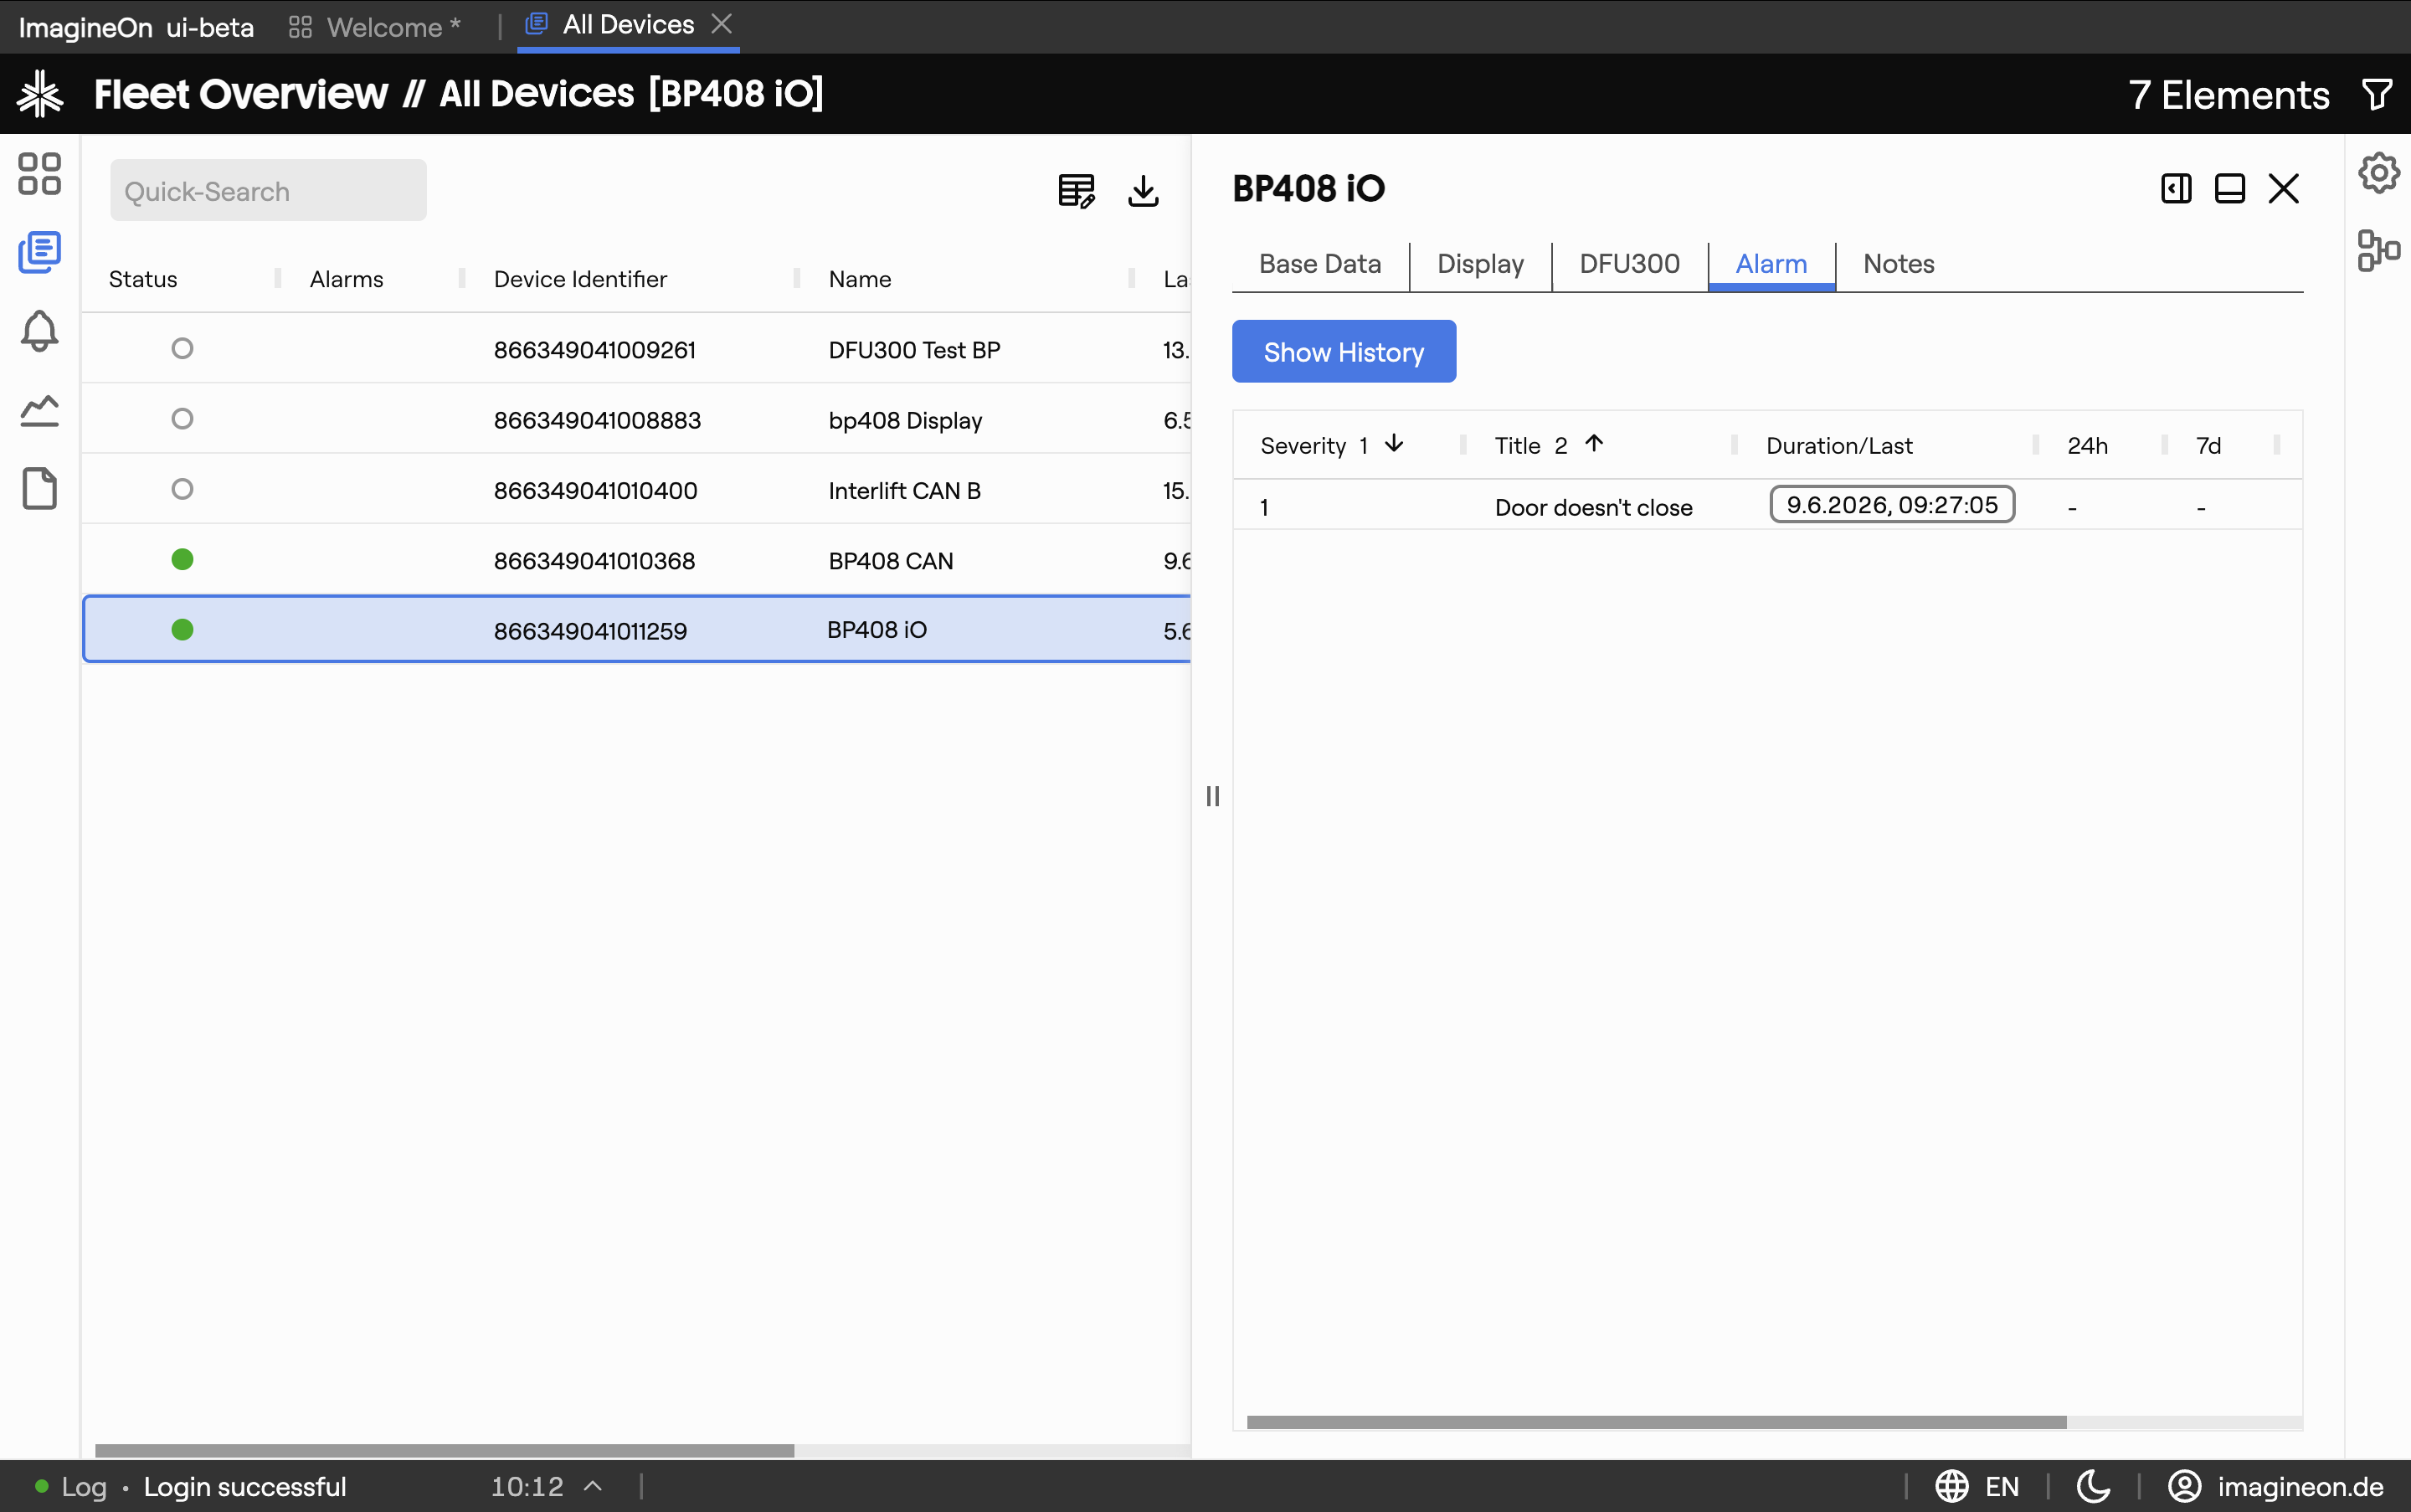
Shows the alarms configured for this specific device, with their current state (triggered / cleared), last state change timestamp and severity.
From here you can:
- Click a row to see the alarm's history.
- Click View in Alarm View on an active alarm to open it in the dedicated Alarms view, which has full start/end snapshots and graph links.
The Alarms tab's icon shows a red badge whenever at least one alarm on this device is currently active.
6. Notes tab
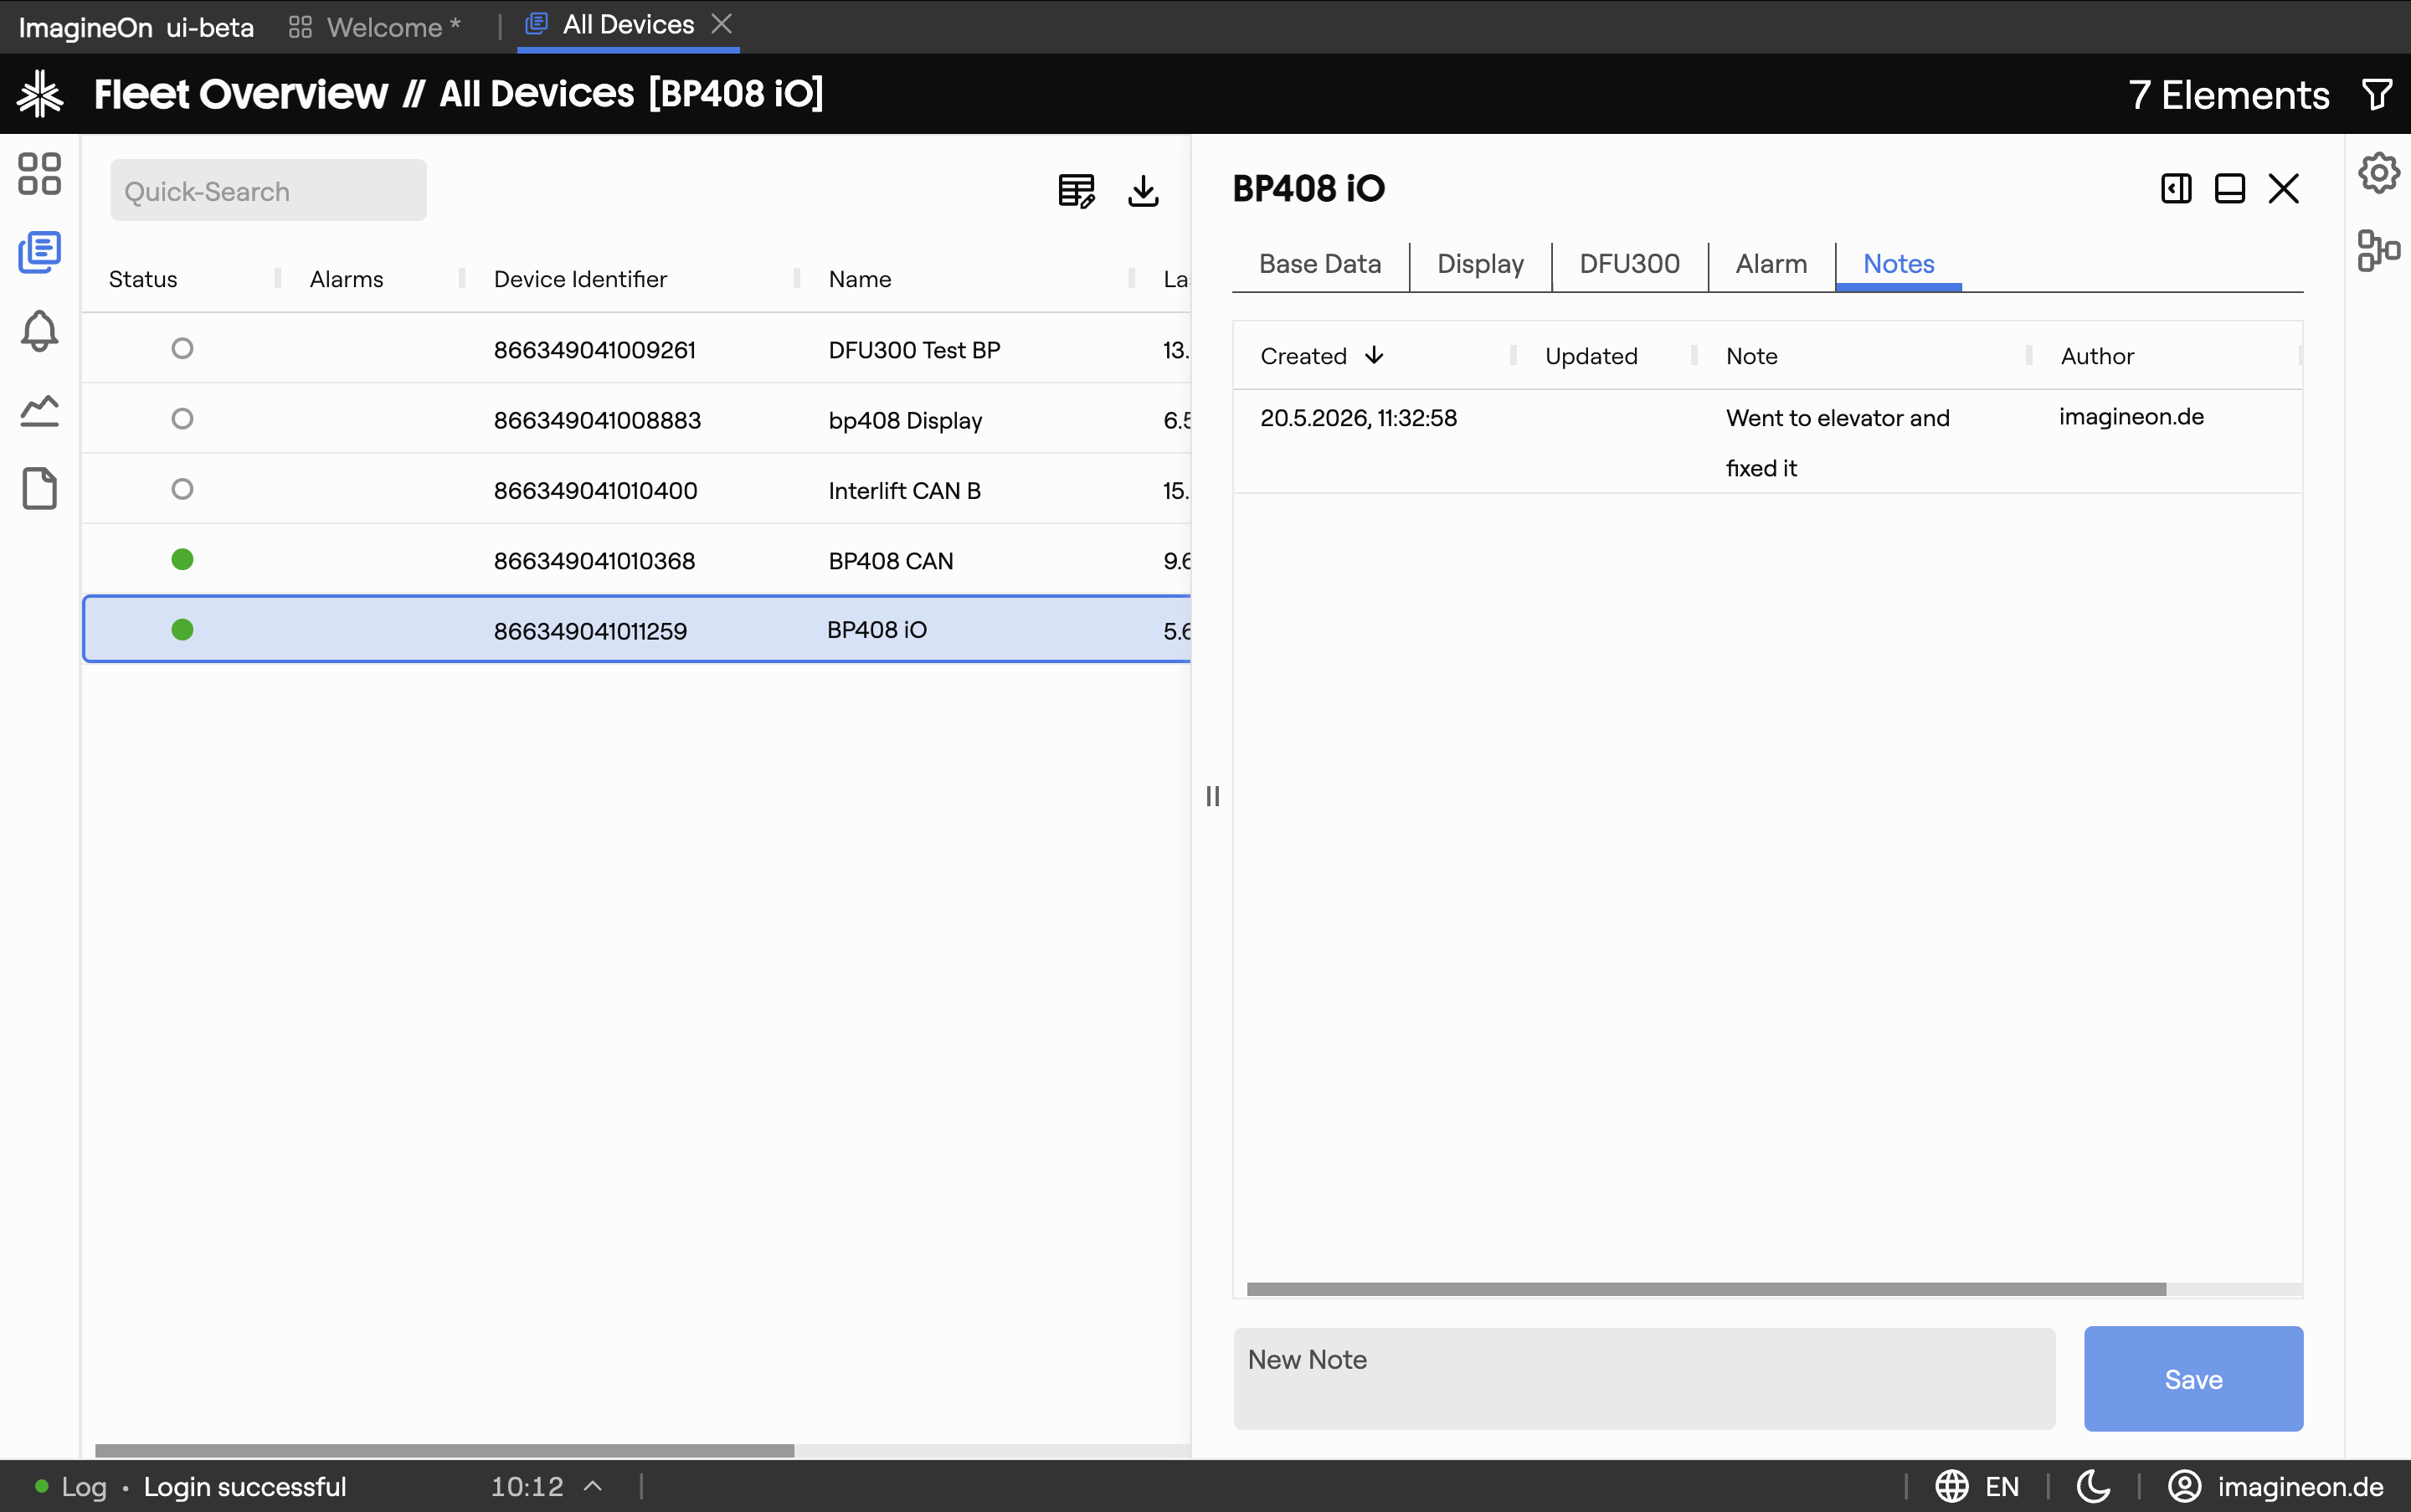
A shared scratchpad for the device. Use it for handover notes, on-site observations, or anything else the team should know.
- Existing notes appear in a table with author, creation date and last-modified date.
- Click a note's text to edit it inline; press Enter to save.
- Below the table is a new-note text area. Your username is filled in automatically as the author. Type and click Save to add the note.
Notes are persisted on the backend and visible to anyone with access to this device.
7. Deep links and tab forwarding
Heads-up. These URL patterns are reliable when produced by Coldwave itself. Hand-constructed URLs from another user may not land where you expect — see URLs and tabs.
Other parts of Coldwave can link straight into a specific tab:
| URL | Effect |
|---|---|
/fleet/<deviceId>/data | Open the device's Data tab. |
/fleet/<deviceId>/device-telemetry/<serviceId> | Open a specific telemetry tab. |
/fleet/<deviceId>/device-alarm | Open the Alarms tab for the device. |
/fleet/<deviceId>/device-notes | Open the Notes tab. |
If you land on /fleet/<deviceId> with no tab, Coldwave opens the tab you last visited for that device (or the Data tab if you've never opened it before).
To plot a telemetry property in the Analytics view, copy the property identifier from the telemetry tab and use the Analytics deep-link format.
8. Persistence — what is remembered
Per-user, persisted between sessions:
- Selected device and tab — restored on page reload, so the same view comes back when you return.
- Per-device "last visited tab" — when you re-select the same device later, Coldwave returns you to where you were.
Always fresh on every visit:
- Telemetry values — live from the backend.
- Alarm states — live from the backend.
Notes and editable metadata are stored on the backend and visible to everyone with access to the device.