Appearance
Alarm User Guide — The Alarm View
The Alarm view (/alarm) is Coldwave's incident workspace. It lists every alarm that has fired across your fleet — active and historic — and lets you drill into a single alarm to see the device state at the moment it triggered, the state at the moment it cleared, and jump straight to the Graph view for further investigation.
This guide walks through the view area by area. Screenshots show a typical setup with a handful of alarms; your own data will look different but the controls are the same.
Contents
- Page layout
- Time range and loading
- Alarm table
- Quick info panel
- Alarm detail tabs
- Jumping to the Graph view
- Deep links
- Persistence — what is remembered
1. Page layout
The Alarm view is a split panel: alarm list on one side, alarm detail on the other.
| Area | What lives there |
|---|---|
| Time range controls | Toolbar above the table — choose how far back to load alarms from. See §2. |
| Alarm table | All alarms in the chosen window, sortable and filterable. See §3. |
| Quick info panel | The strip above the detail tabs — shows the alarm title, status, device and timing. See §4. |
| Tab bar | Horizontal strip with Start, End and Insight tabs. See §5. |
| Detail panel | Snapshot of device state for the currently selected tab. |
When nothing is selected the detail panel is empty. Click any row to open the alarm.
2. Time range and loading
The alarm table is loaded for a chosen time window. Use the controls above the table:
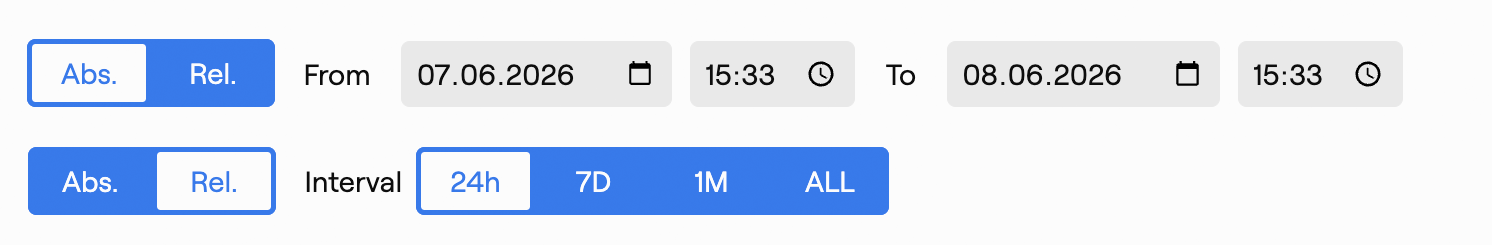
- Relative presets — e.g. last 24 hours (default), last 7 days, last 30 days.
- Absolute range — pick specific From and To dates.
- Load — re-fetches the alarm list for the chosen window.
Tip. If you pick a very long window (or "all time"), you'll see a confirmation prompt — large windows can be slow and return a lot of rows.
While the alarm list is open, active alarms keep updating automatically: durations tick up in real time, new alarms appear at the top, and an alarm that clears flips from active to done without reloading.
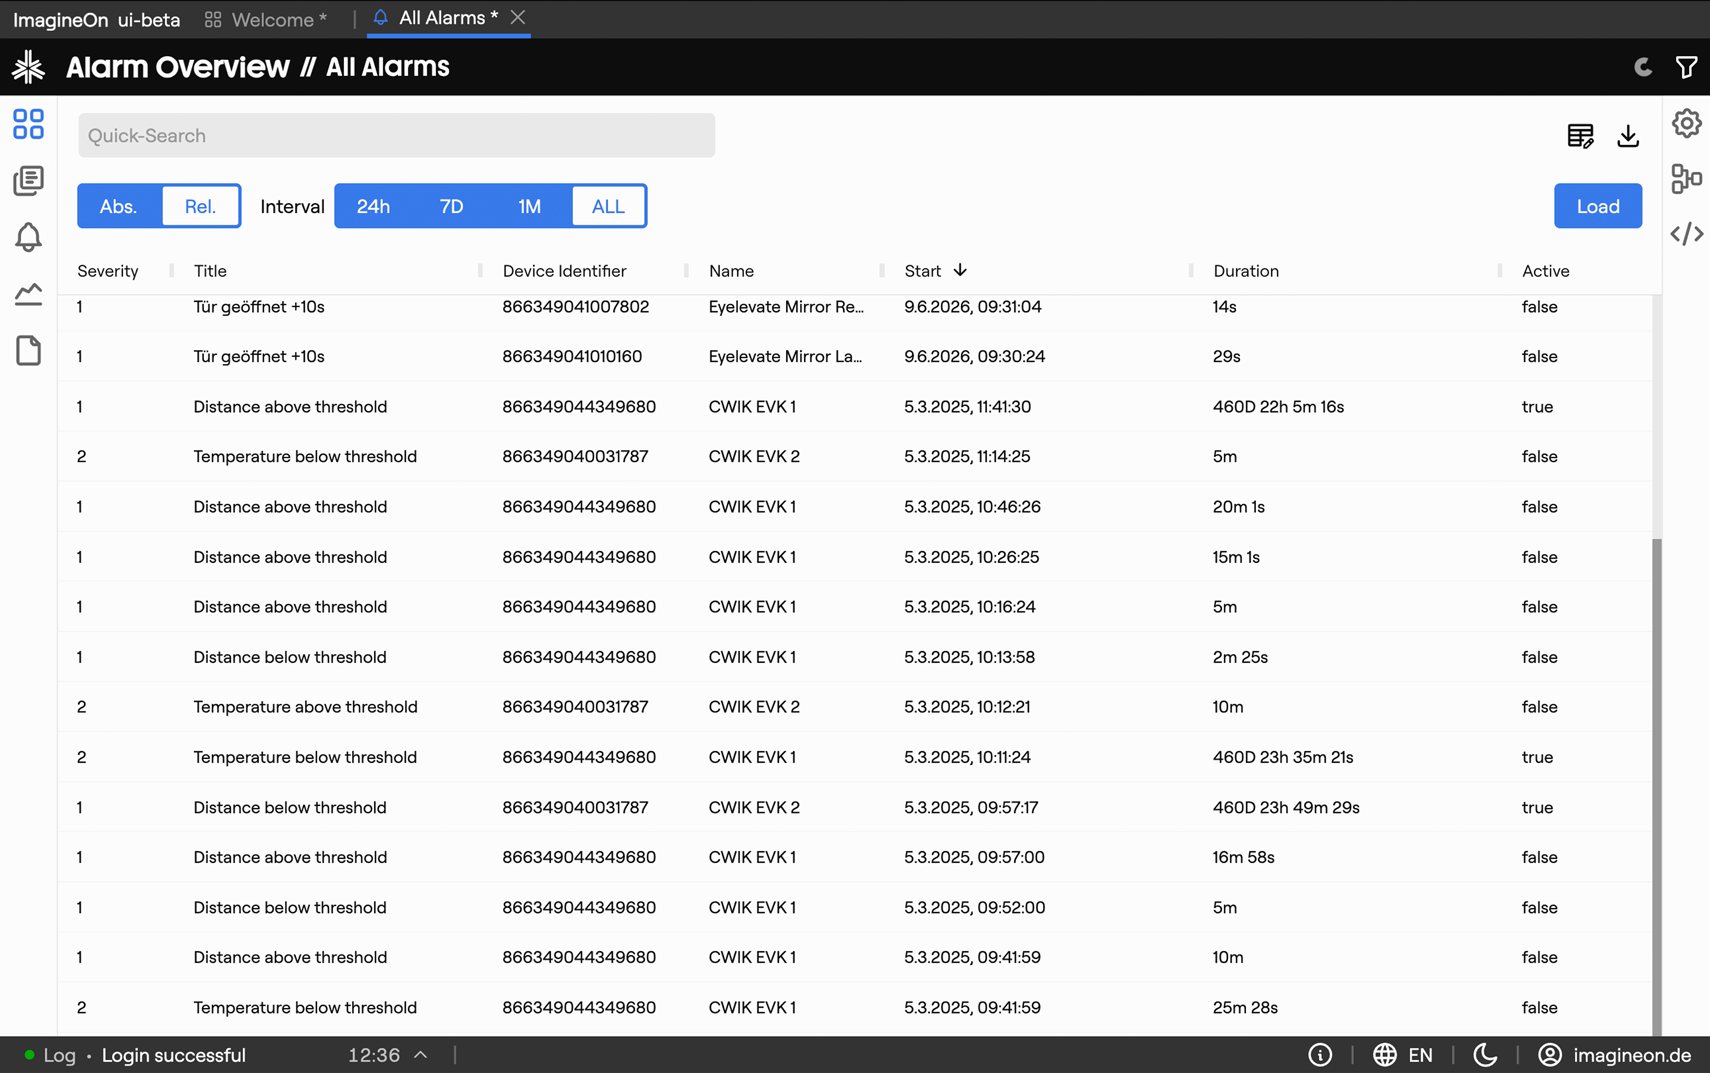
3. Alarm table
Default columns:
| Column | Meaning |
|---|---|
| Severity | Numeric criticality level (higher = more critical). |
| Title | Alarm name as configured in the alarm editor. |
| Device Identifier | The device that triggered the alarm. |
| Device Name | Friendly name of the device. |
| Start Time | When the alarm fired (default sort: newest first). |
| Duration | Elapsed time — counts up live for active alarms, fixed for resolved ones. |
| Active | True while the alarm is ongoing, false once it has cleared. |
Each column can be filtered (open the column's filter menu in the header) and sorted (click the header). The Edit Columns icon in the toolbar lets you add, remove or reorder columns; the layout is remembered per user.
The table also has a CSV export button to dump the currently visible alarms (after filters) to a file.
Alarms can be filtered by severity, title, device, duration, or active/historic status. Combine column filters to narrow down, e.g. "all critical alarms on device bp408 from the last week".
Click any row to open the alarm in the detail panel. The URL updates to /alarm/<deviceId>/<watcherId>/<index>/<tab> so the selection survives a reload.
4. Quick info panel
Above the tab bar sits a status strip:

- Alarm status — ACTIVE (red) or DONE (green).
- Device status — ONLINE / OFFLINE of the device at this moment.
- Alarm title — alarm name (truncated if very long).
- Device name — friendly device name.
- Start time — formatted as locale date/time.
- Duration — human-readable elapsed time (e.g.
2h 15m 30s); continues to tick for active alarms.
5. Alarm detail tabs
The detail panel has three tabs:
5.1 Start tab
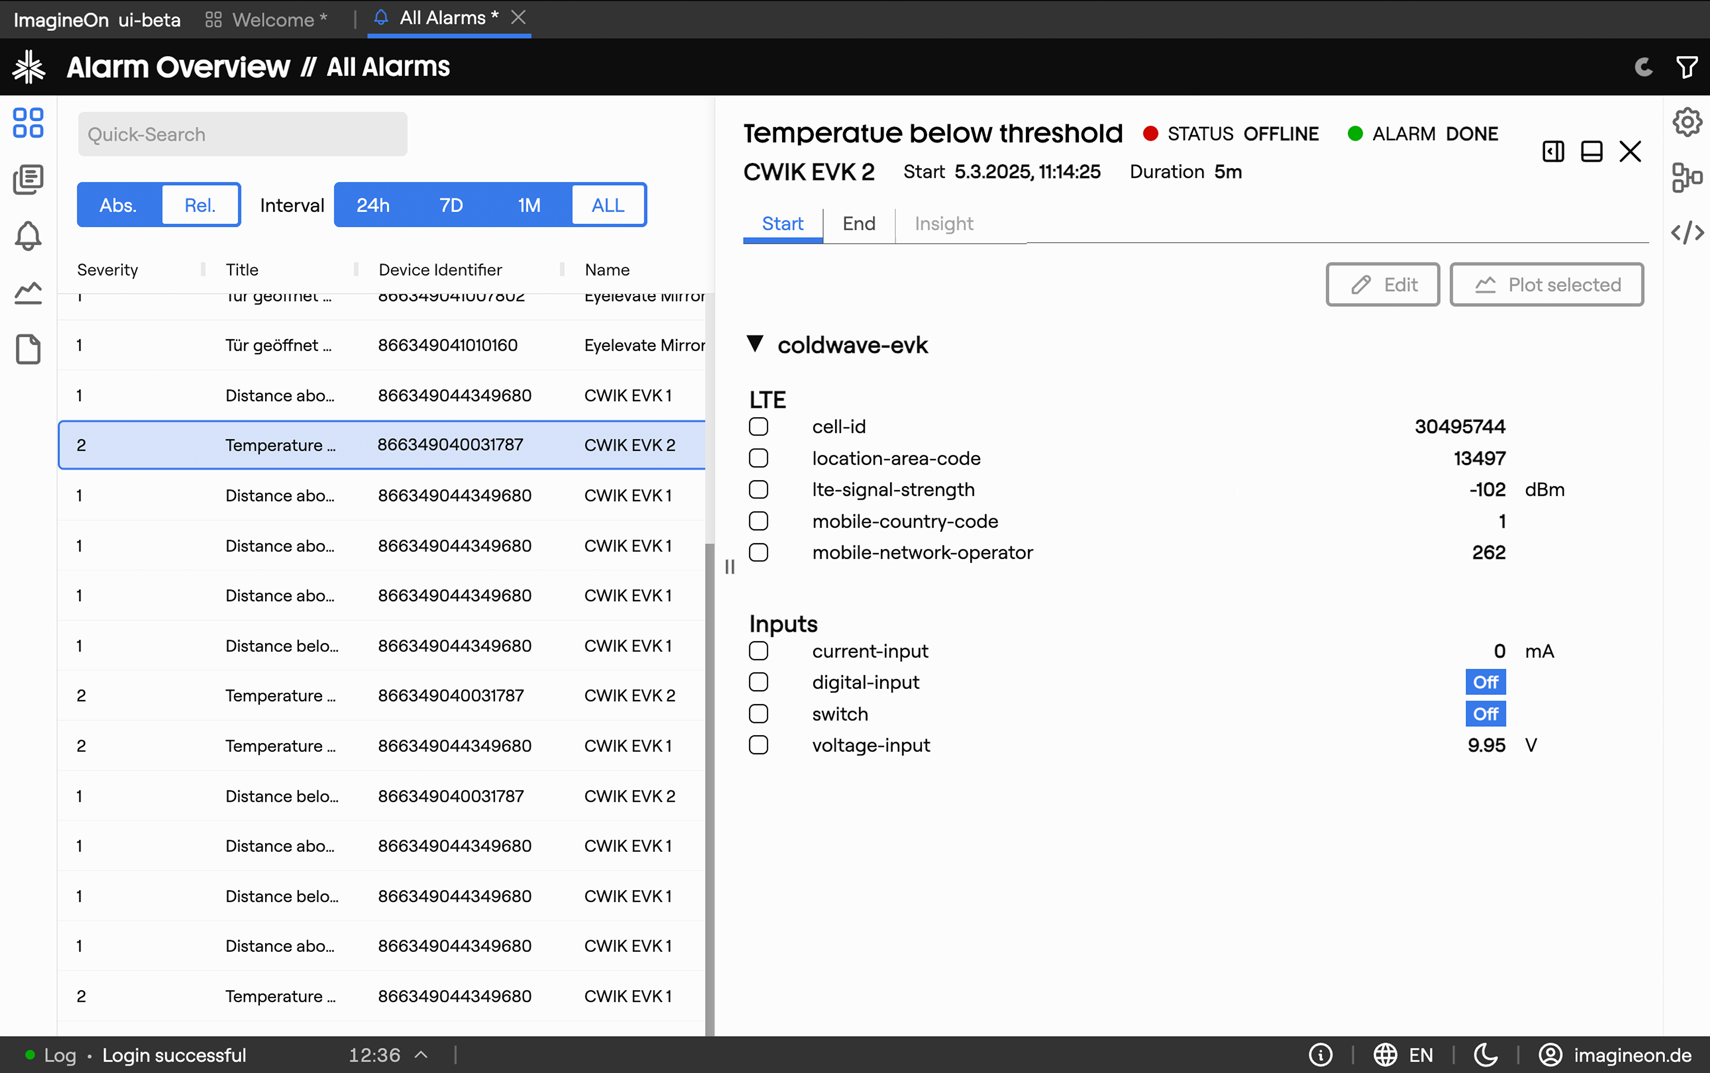
A snapshot of the device state at the moment the alarm fired. Every relevant property of the alarm's services is listed with the value it held when the alarm triggered.
- Property names use translations from the device schema where available.
- Numeric values include their unit.
- Bool and enum values are shown as their human-readable state name.
This tab is read-only — its purpose is forensic: what did the device look like when this fired?
Select one or more properties with their checkboxes and click Show Graph to jump to the Graph view for those properties, with the time range pre-set around the alarm. See §6.
5.2 End tab

Same as the Start tab, but for the moment the alarm cleared. Useful for comparing "before and after":
- If the alarm is still active, the End tab shows No end state — alarm is still active.
- If the device didn't capture an end snapshot (rare), the tab is empty with an explanatory message.
The same Show Graph shortcut is available here.
5.3 Insight tab

Placeholder for future automated analysis (correlations, root-cause hints). Currently empty.
6. Jumping to the Analytics view
From the Start or End tab, tick the properties you want to plot and click Show Graph. This opens the Analytics view with:
- Device — pre-selected to the alarm's device.
- Properties — the ones you ticked.
- Time range — centred around the alarm window (from before the start to after the end, or to "now" if still active).
This is the fastest way to ask what was happening just before the alarm? without manually setting up a chart.
7. Deep links
Heads-up. These URL patterns are reliable when produced by Coldwave itself. Hand-constructed URLs from another user may not land where you expect — see URLs and tabs.
Other parts of Coldwave can link straight into the Alarm view:
| URL | Effect |
|---|---|
/alarm | Open the alarm list with the default time window. |
/alarm/<deviceId>/<watcherId>/<index>/start | Open a specific alarm on its Start tab. |
/alarm/<deviceId>/<watcherId>/<index>/end | Open a specific alarm on its End tab. |
<watcherId> is the alarm's configuration identifier; <index> is the occurrence index (an alarm that has fired five times has occurrences 1–5).
8. Persistence — what is remembered
Per-user, persisted between sessions:
- Alarm table column layout — visibility, order, width and default sort.
- Column filter settings.
- Time range preset — defaults to the last 24 hours.
Reset between sessions or driven by URL:
- Selected alarm in the detail panel — tied to the URL; cleared when you navigate away.
- Current detail tab (Start / End / Insight).
Alarm definitions, their state snapshots and severities are stored on the backend and are the same for every user with access to the device.