Appearance
Reports — Building Queries
The Reports view (/data) is Coldwave's tabular analytics workspace. Where the Analytics view is built for visualising time-series, Reports is built for querying it — picking devices and properties, narrowing down with filters, bucketing into time intervals, computing derived columns, and exporting the result.
This page covers the query-building side: layout, selectors, transforms, SQL preview, data quality and period-over-period comparison. For the result table, exporting and sharing, see Reports — Results & Export.
Status note. The Reports view is part of the improved-analytics initiative and is actively evolving. The visual query builder and SQL preview are functional today; a free-form SQL editor and saved-query library are planned follow-ups. Where a feature is still in flux this guide says so.
Contents
- Page layout
- Selectors — devices, properties, time
- The transform pipeline
- SQL preview
- Data quality panel
- Period-over-period comparison
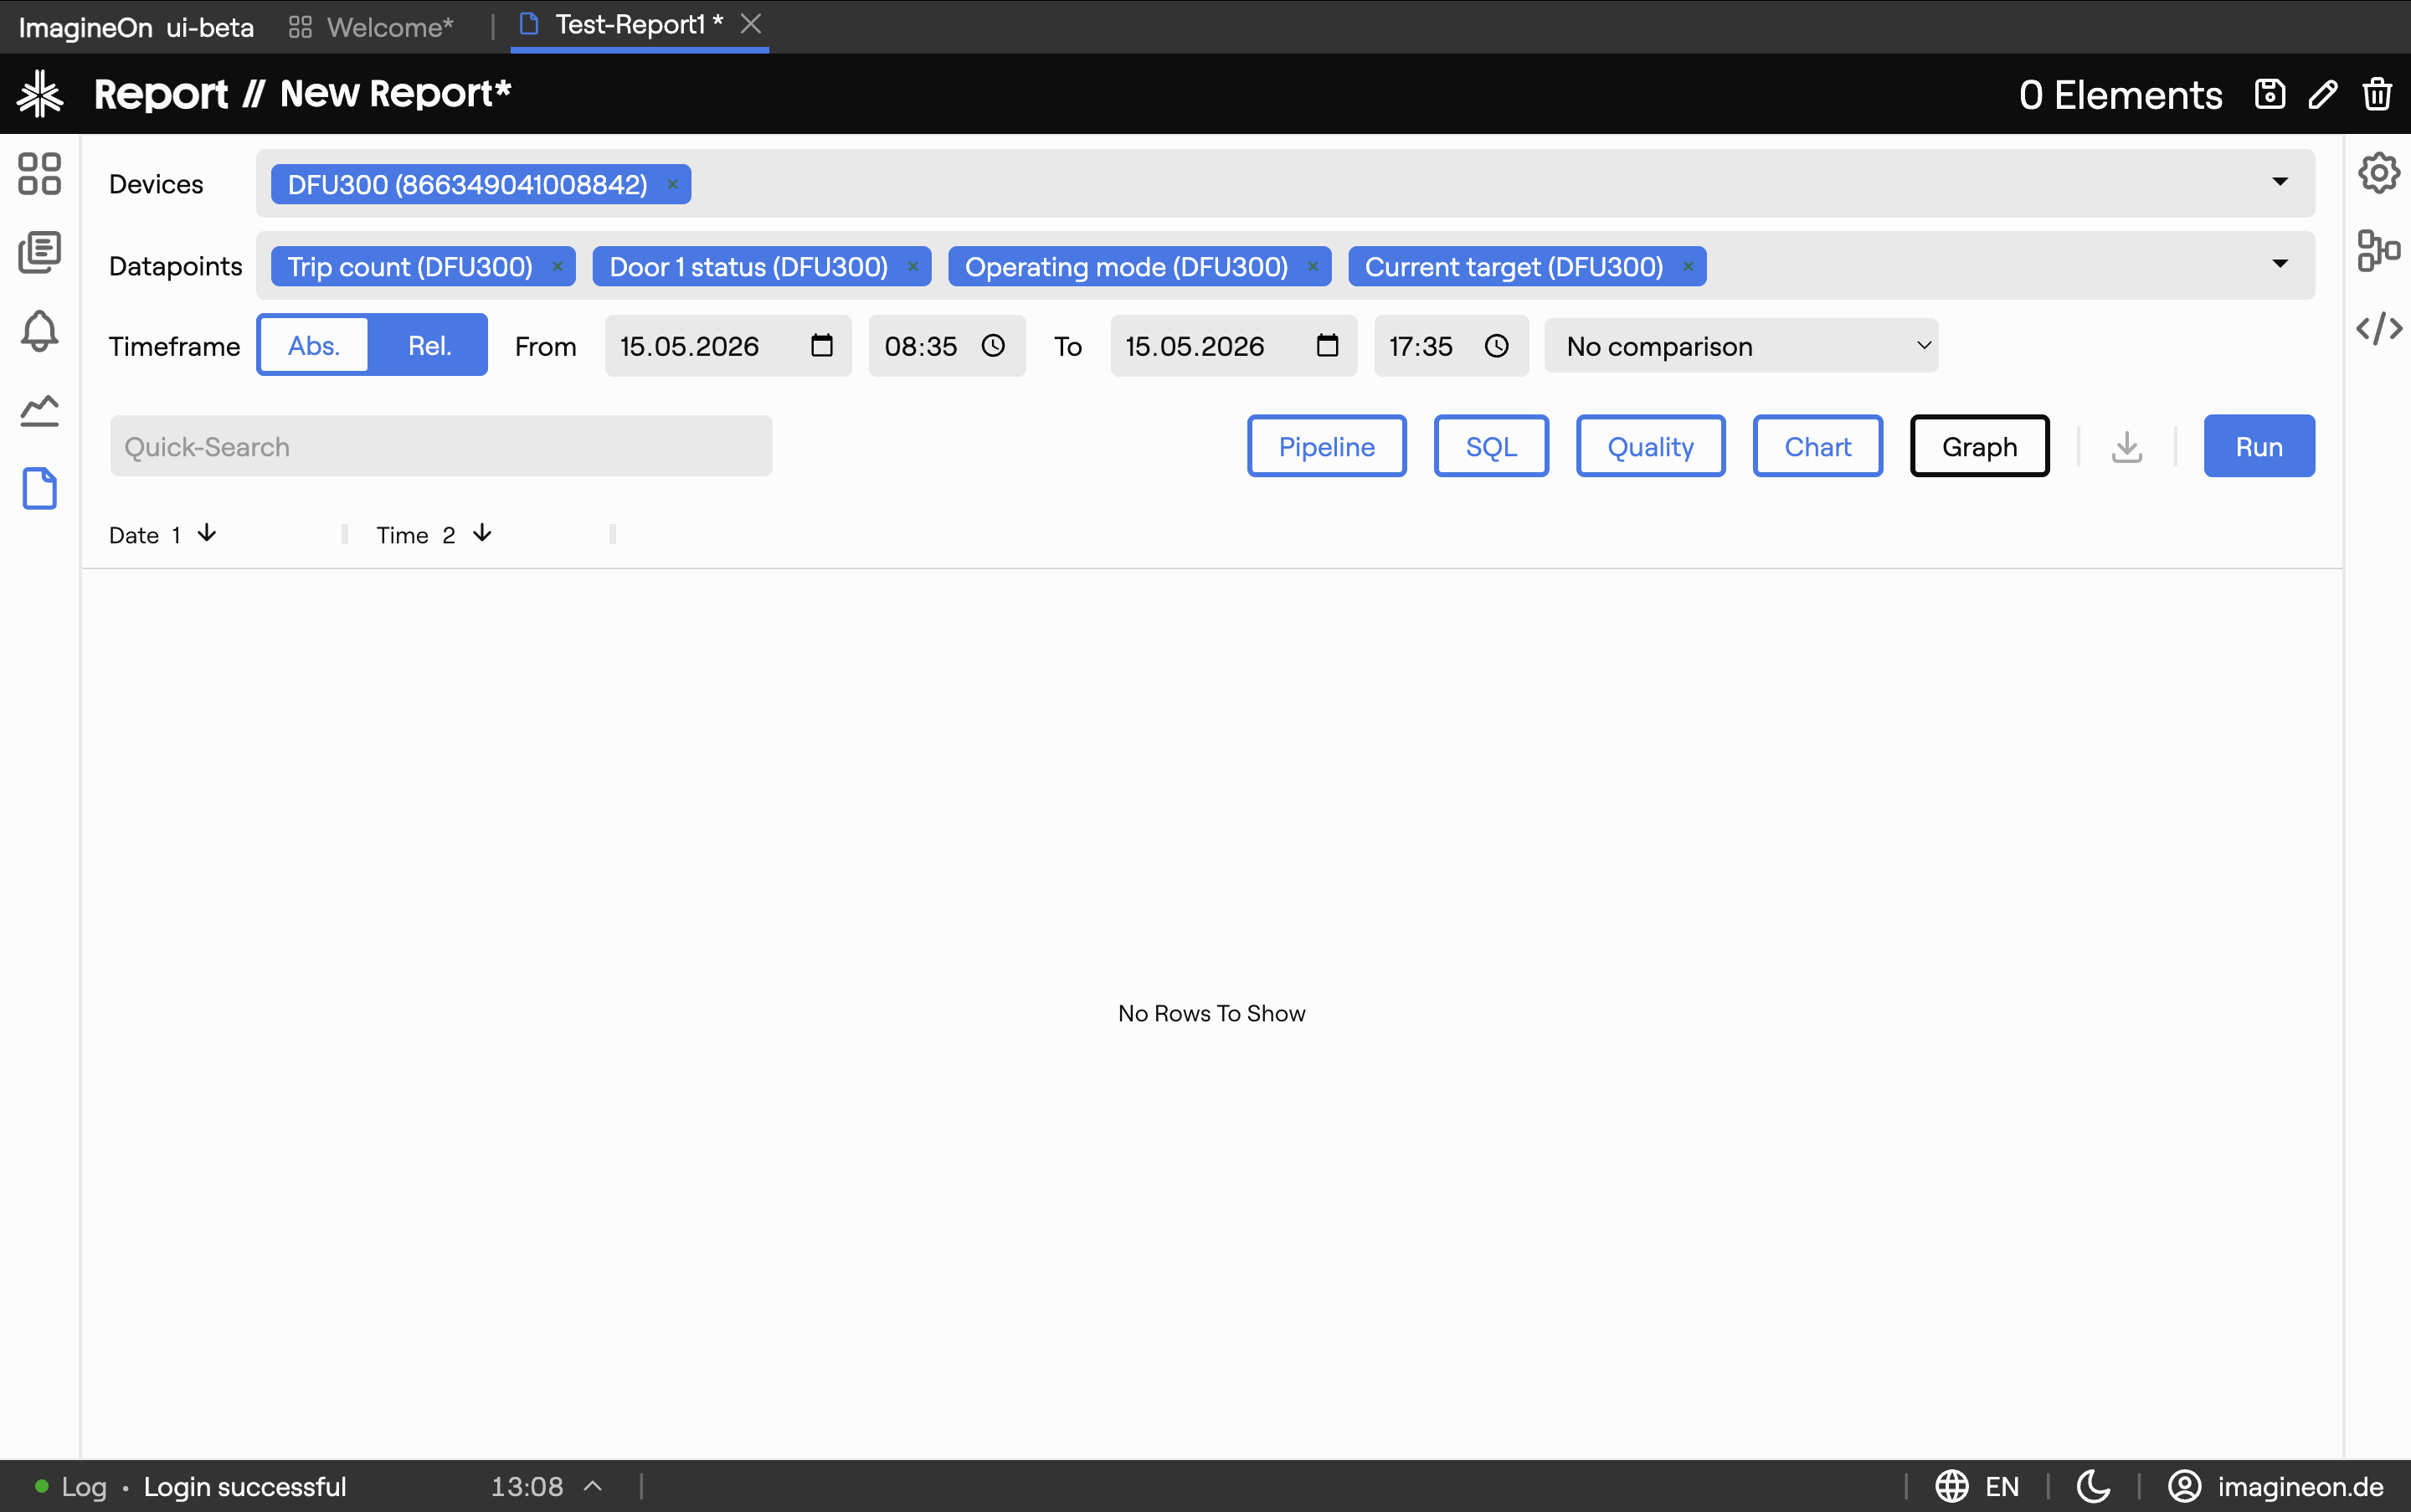
1. Page layout
The Reports view stacks a query builder on top of a result table, with a toolbar in between.
| Area | What lives there |
|---|---|
| Selectors | Devices, properties, time range, comparison toggle. See §2. |
| Transform pipeline | Chip-based visual builder for filter / bucket / compute / sort / topN / groupBy / pivot. See §3. |
| SQL preview | Read-only SQL-style view of the query you've built. See §4. |
| Data quality panel | Stats about the raw result before transforms — gaps, null counts, timestamp coverage. See §5. |
| Chart preview | Optional ag-charts preview of the result. Covered in Results & Export. |
| Result table | The table the query actually produced. Covered in Results & Export. |
| Toolbar | Export buttons, layout toggles. Covered in Results & Export. |
Each builder panel can be collapsed by clicking its header.
2. Selectors — devices, properties, time
Use the selectors at the top of the page to describe what data you want.
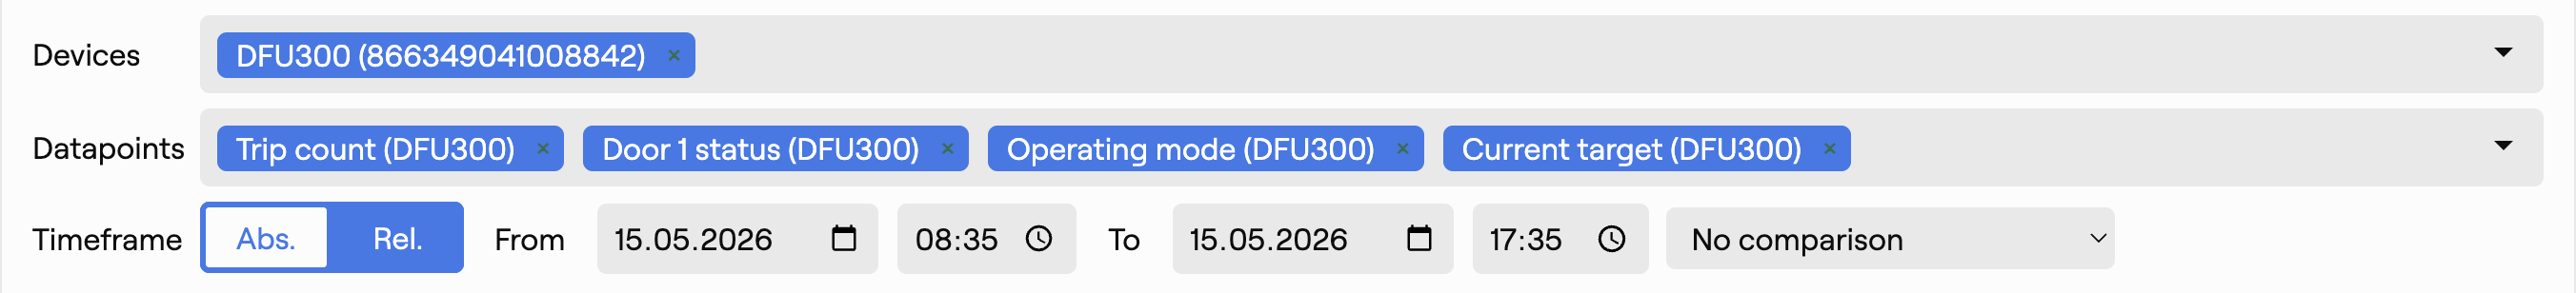
- Devices — multi-select of devices in your fleet.
- Properties — multi-select of properties exposed by those devices. Only properties the selected devices share are valid.
- Time range — either a relative preset (last hour / day / week / …) or an absolute From / To pair.
- Prepend first value — when on, the query also fetches the last value before the window for each series so the chart and table don't start with a gap.
- Compare — adds a second, earlier window for period-over-period comparison. See §6.
The query re-runs automatically whenever you change a selector. There is no explicit Run button under normal use.
3. The transform pipeline
Below the selectors is a chip-based transform pipeline. Each chip represents one transformation applied in order to the raw result. Click Add transform to insert one.

| Kind | What it does |
|---|---|
| Filter | Keep only rows matching an expression — e.g. temperature > 60. Operators include =, ≠, <, >, ≤, ≥, AND, OR, NOT. |
| Bucket | Aggregate values into time buckets — e.g. 1-minute averages. Supported aggregations: avg, min, max, first, last, count, sum, median, p90, p95, p99, stddev. |
| Computed | Add a derived column from an expression — e.g. power = voltage * current. |
| Sort | Order rows by a chosen column, ascending or descending. |
| Top N | Keep only the top (or bottom) N rows by a column. |
| Group by | Roll up across devices using a metadata field — e.g. group by site and average. |
| Pivot | Collapse one axis into columns — e.g. one column per device instead of one per property. |
Each chip opens an editor modal with kind-specific fields. Chips can be reordered (drag), disabled (toggle), or removed (×).
Transforms run client-side, in a Web Worker for complex pipelines, so they stay responsive on wide result sets.
4. SQL preview
The SQL preview panel shows a read-only, SQL-style rendering of the query you've built. It's a way to verify the query is doing what you think it is — particularly useful when you have several transforms stacked up.

Planned. A free-form SQL editor (with autocomplete) is on the roadmap. Today this panel is read-only.
5. Data quality panel
The Data quality panel analyzes the raw result before transforms and tells you:
- Time coverage — how much of the requested window actually has data.
- Gap distribution — where the gaps are and how long.
- Null counts — per property.
- Duplicate timestamps — if any.
Use this when a query result looks suspicious. A bucket-average that drops to zero is often just an underlying gap; the quality panel catches that.

6. Period-over-period comparison
The Compare selector overlays an earlier window of data alongside the current window:
- Previous period — same length, immediately before the current window.
- Previous week — same window, shifted back by 7 days.
- Previous year — same window, shifted back by 365 days.
The comparison series are suffixed ::cmp and shown as additional columns, so you can compare this week vs. last week in the same table. The chart preview overlays them as well.